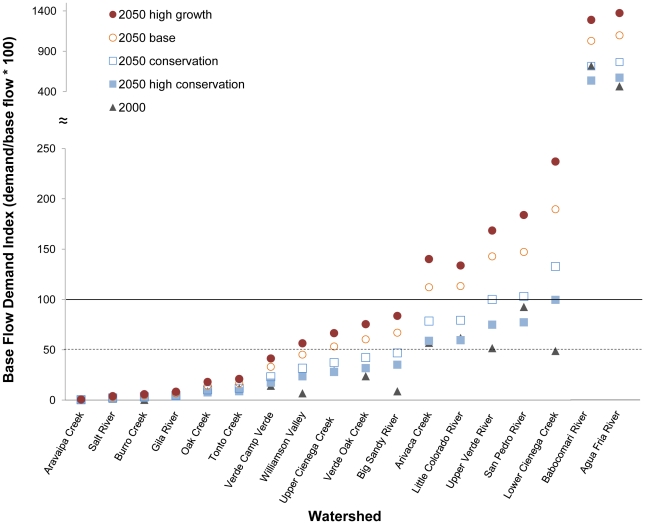
Figure 2. Base flow demand index (BDI) for 18 watersheds for the year 2000 and across four future scenarios.
BDI is calculated as the percentage of municipal water demand to river base flow within a watershed. The solid horizontal line indicates the threshold where demand exceeds 100% of base flow; the dashed line delineates the transition from low BDI (≤50% of base flow) to stressed BDI (>50%–100% of base flow). See text for description of scenarios.

