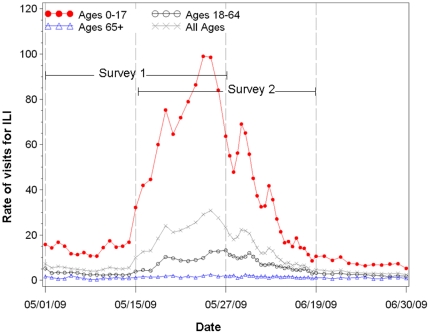
Figure 1. Overall and age-specific daily rates of ED visits for ILI, NYC, May–June 2009.
Rate is number of emergency department (ED) visits for influenza-like illness (ILI) per 100,000 age-group specific population. Survey 1 was conducted from May 21–27 and measured ILI from May 1–27. Survey 2 was conducted June 15–19 and measured ILI from May 15 to June 19. The overlap period is from May 15–May 27.

