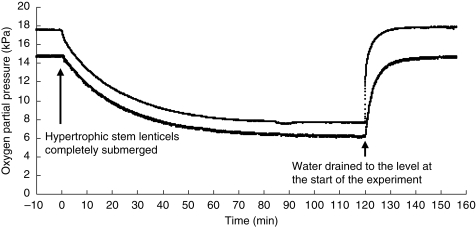
Fig. 4.
The effect of complete submergence of hypertrophic stem lenticels on pO2 values in aerenchyma in the lower stem of soybean. The upper and lower lines represent the pO2 values in the stem aerenchyma at 13 and 51 mm below the water level, respectively. The experiment was repeated twice (not shown)

