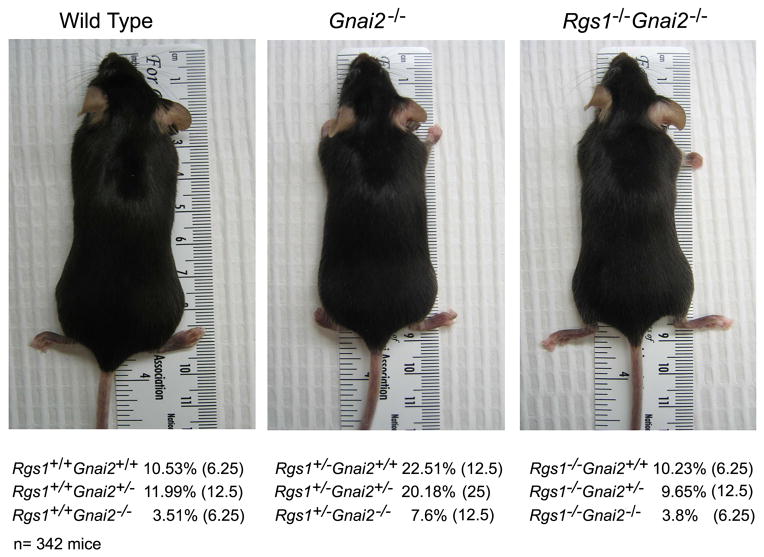
Figure 1.
Intercross of Rgs1+/− and Gnai2+/− mice. Photographs of representative wild type, Gnai2−/−, and Rgs1−/−/Gnai2−/− C57/BL6 mice. The result of genotyping mice from double heterozygote crosses is shown below the photographs. The percentage of each of the different genotypes is shown and in parentheses the predicted frequency of the genotype. The results are from genotyping 342 mice. The p values are significantly different for each observed genotype number vs. expected genotype number (P< 0.001 by chi-square tests).

