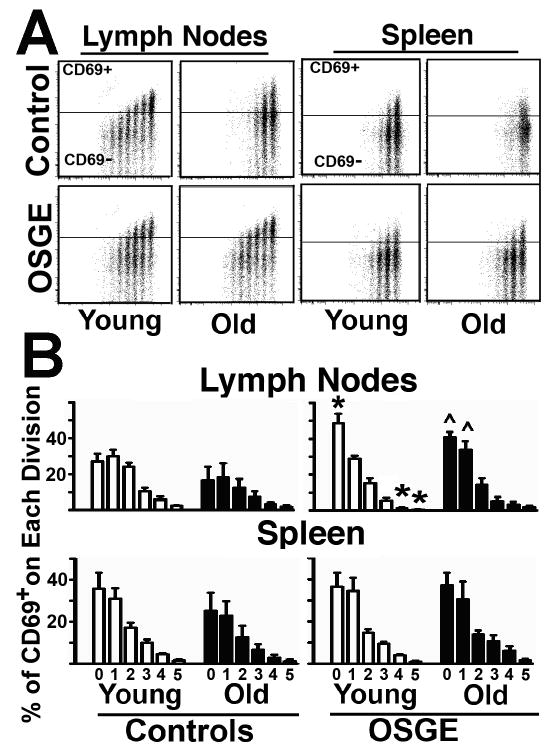
Figure 3. Analysis of CD69 expression in Tgr+ cells from young and old AND mice show that OSGE, but not age, affects the late decline in CD69 in cells that have divided.
A- 72 hours after adoptive transfer, untreated and OSGE-treated Trg+ cells were gated and analyzed as described in Figure 1, but with the addition of CD69 staining and analysis. The crossbar in each dot-plot represents the threshold used to discriminate CD69+ from CD69 negative cells in each peak defined by CFSE expression. B-Matched sets of at least 2 young (open bars) and 1 old (filled bars) in each of 5 experiments were quantified for CD69 expression. The panel shows the mean percentage of CD69+ cells ± SEM for each cell division peak delineated by CFSE level. No statistical differences were found between untreated young and old controls samples. The * indicates statistical significant differences relevant to young untreated mice (control), while the ^ represents significant differences to old untreated (control) from the same CFSE peak.

