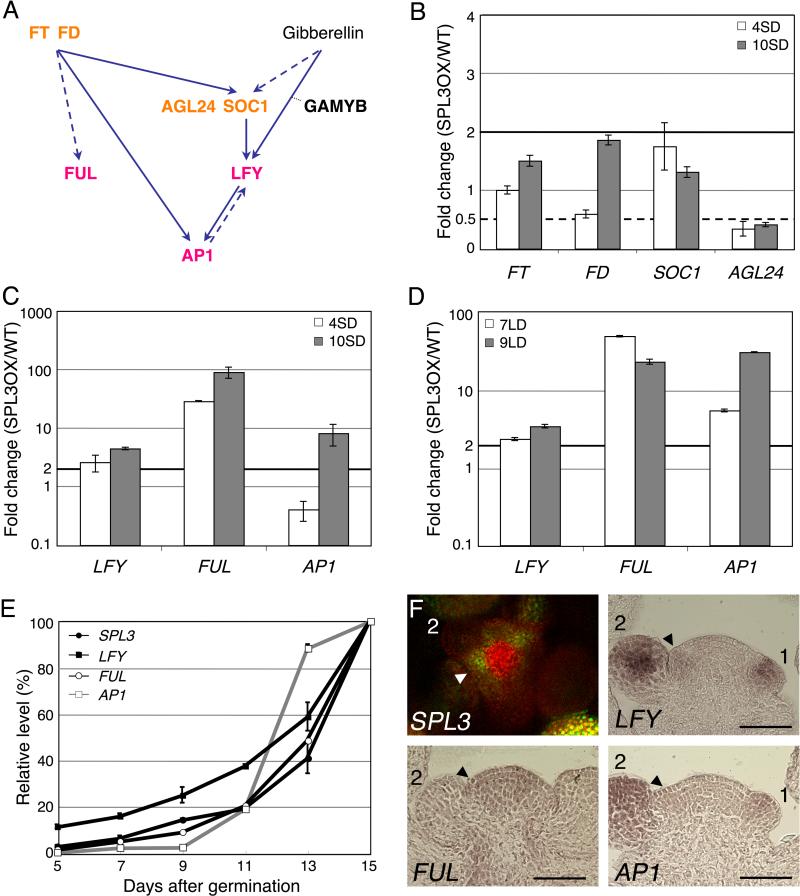
Fig. 1. SPL3 activates meristem identity gene expression.
(A) Schematic representation of the known interactions involved in the meristem identity (MI) switch (see text for details). Flowering time regulators are indicated in orange, MI regulators in pink. Solid arrows denote direct interactions, dashed arrows denote direct or indirect interactions. (B-D) qRT-PCR analysis of flowering time gene (B) or MI gene expression (C, D) in 35S:SPL3Δ (SPL3OX) compared to wild-type plants. Plants were grown in short-day (SD) for 4 and 10 days (B, C) or in long-day (LD) for 7 and 9 days (D). (E) Temporal expression of SPL3, LFY, FUL and AP1 in wild-type plants grown in LD. The ratio of the expression at each time-point over the final expression level is graphed. (B-E) Values are mean +/- SEM. Black solid horizontal line: two fold increase, black dotted line: two fold decrease. (F) Confocal image of pSPL3:GFP-SPL3 (top view of inflorescence meristem) and in situ hybridization of LFY, FUL and AP1 (longitudinal section through inflorescence meristem). Arrowheads point to the incipient flower primordium, numbers denote stages of flower development. Bar: 50μm.

