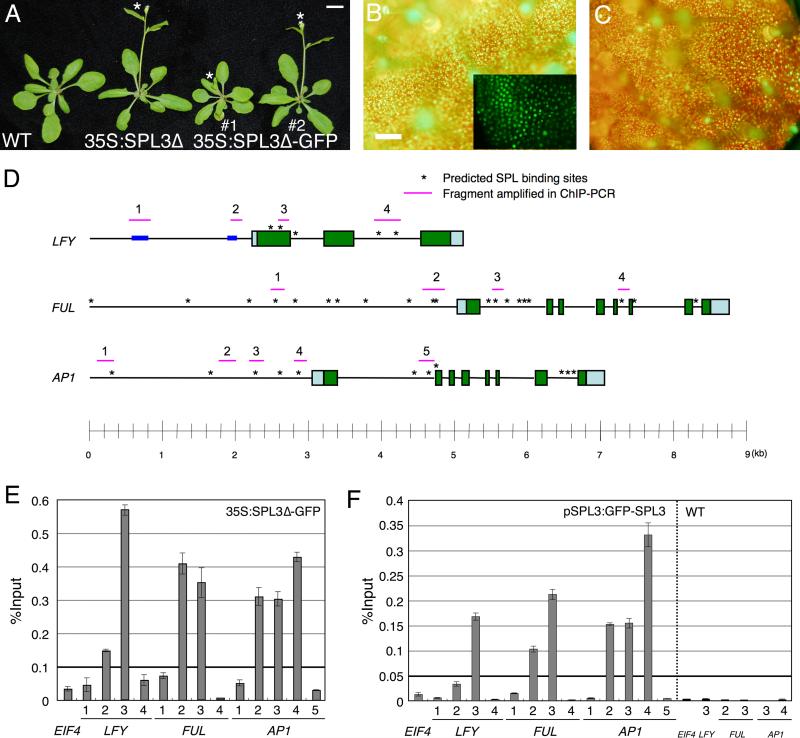
Fig. 3. SPL3 binds regulatory regions of meristem identity genes in vivo.
(A) Early flowering phenotype of LD-grown SPL3 overexpressing plants compared to wildtype. The asterisk marks the primary inflorescence bolt. Bar; 1 cm. Fluorescence image of 35S:SPL3Δ-GFP in leaf one (B) and pSPL3:GFP-SPL3 in leaf four (C). Inset in (B); close-up confocal microscopy image. Bar; 1 mm. (D) Schematic of the LFY, FUL and AP1 loci. Pale blue and green boxes represent untranslated regions and exons, respectively. Asterisks indicate computationally identified SPL consensus motifs. Pink horizontal lines: fragments amplified in by qPCR after ChIP. Blue boxes: regulatory regions in the LFY promoter previously identified (Blazquez and Weigel, 2000). (E, F) qPCR of anti-GFP ChIP in 35S:SPL3-GFPΔ (E), pSPL3:GFP-SPL3 and wildtype (F). Plants were grown in SD for 10 days (E) or LD for 7 days (F). Immunoprecipitated DNA enrichment is presented as percent input DNA. Shown is the mean +/- SEM.

