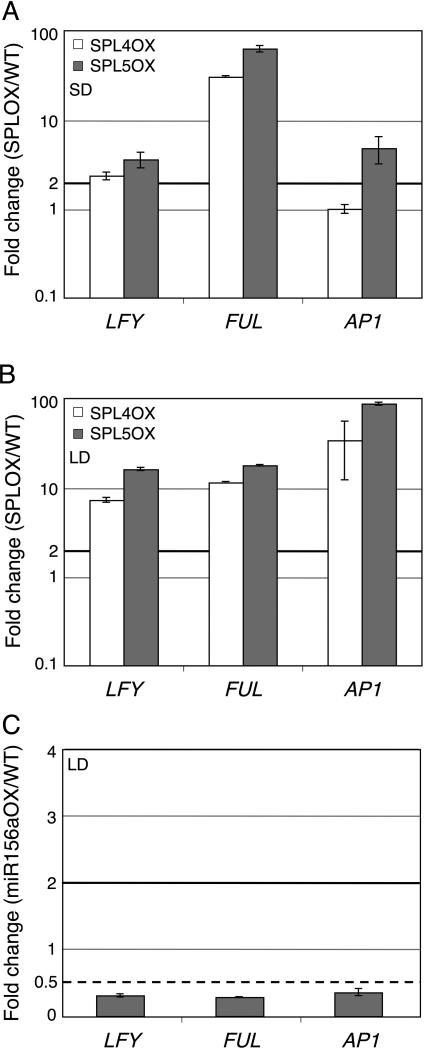
Fig. 4. SPL4 and SPL5 upregulate meristem identity genes.
qRT-PCR analysis of meristem identity gene expression in 35S:SPL4Δ and 35S:SPL5Δ compared to wild-type plants (A, B) and in 35S:miR156a compared to wild-type plants (C). Plants were grown in SD for 10 days (A) and in LD for 9 days (B) or 10 days (C). Shown is the mean +/- SEM relative to the wildtype. Black solid horizontal line: two fold increase, black dotted line: two fold decrease.

