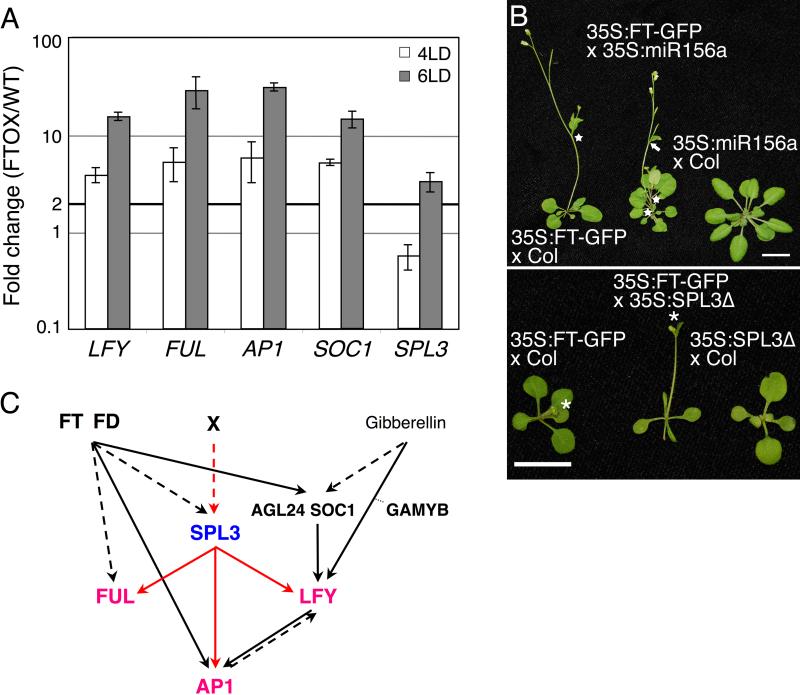
Fig. 5. Regulatory interactions between flowering time and meristem identity regulators.
(A) qRT-PCR analysis of the known FT targets LFY, FUL, AP1 and SOC1 as well as SPL3 in 35S:FT-GFP plants grown in LD. Plants were harvested at day 4 and day 6. Shown is the expression mean +/- SEM relative to the wild type. Black solid horizontal line: two fold increase. (B) Phenotypes of F1 progeny of 35S:FT-GFP x 35S:miR156a (top) and 35S:SPL3 × 35S:FT-GFP (bottom). Star: secondary inflorescences, arrow: flower subtended by cauline leaf, asterisk: primary inflorescence. Bar; 1cm. (C) Role of SPL3 in meristem identity transition. Solid arrows denote direct interactions, dashed arrows denote direct or indirect interactions. SPL3 directly regulates LFY, FUL and AP1 transcription (red arrows) and acts in pathway that is partly in parallel with the FT pathway (red dashed arrow).

