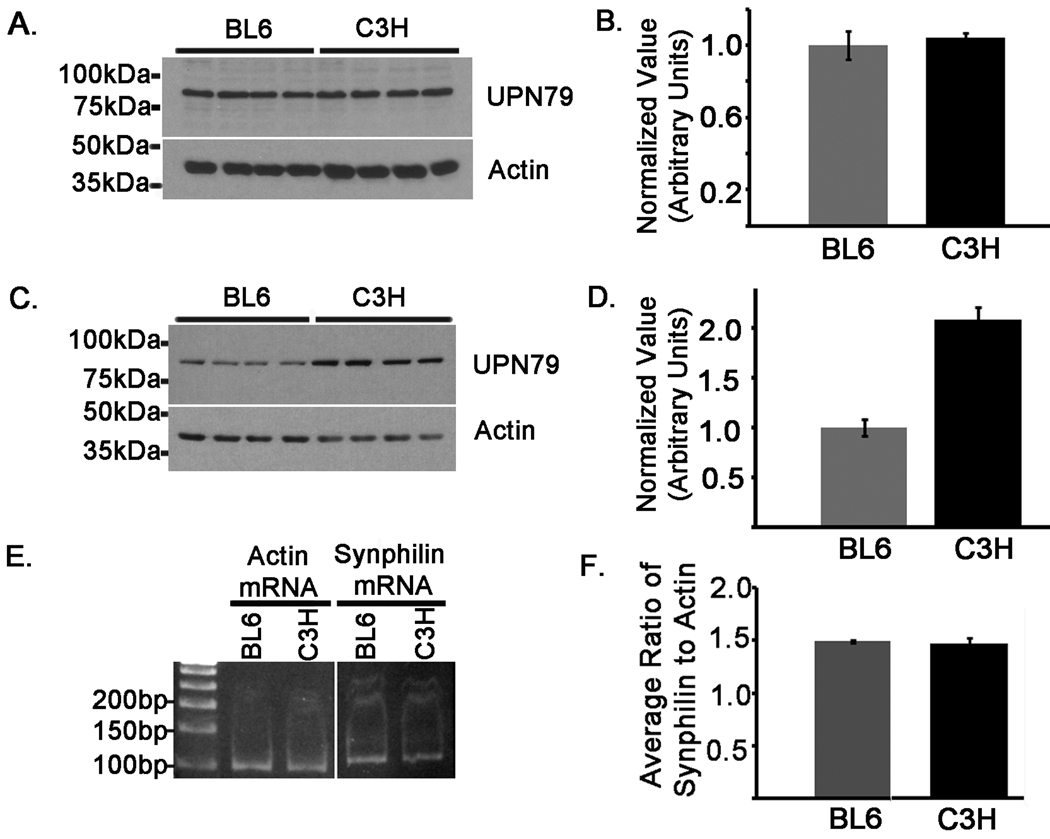
Figure 10.
Synphilin-1 protein levels are increased in C3H mice. Cerebral cortical tissues were harvested from BL6 and C3H mice. Protein lysates were extracted from animals at ages 10 weeks (A and B) and 8 months (C and D). Equal amounts (18 ug) of high-salt protein extracts were loaded onto 10% polyacrylamide gels and analyzed by western blot analysis with the affinity purified polyclonal antibody, UPN79 to assess synphilin-1, as well as an actin antibody to confirm equal protein loading. Four samples were loaded, each from separate mice of the indicated strains. The graphs in B and D show the average ratios of the levels of UPN79 to actin normalized to the values in BL6 animals at the respective aforementioned ages. E) Total RNA was extracted from cerebral cortical tissues that were harvested from the same BL6 and C3H mice analyzed in C. Synphilin-1 and actin mRNA transcripts were quantified using two-step qRT-PCR. Experiments were performed in duplicate and 3 separate samples were analyzed for each mouse strain. The synphilin-1 and actin qRT-PCR products are shown. The image shows the products from one of the mice analyzed for the indicated strains. F) The ratio of the synphilin-1 to actin CT value was calculated for each sample. The graph depicts the average of the ratios between replicate samples for each mouse strain. The error bars indicate standard deviation (n=6).

