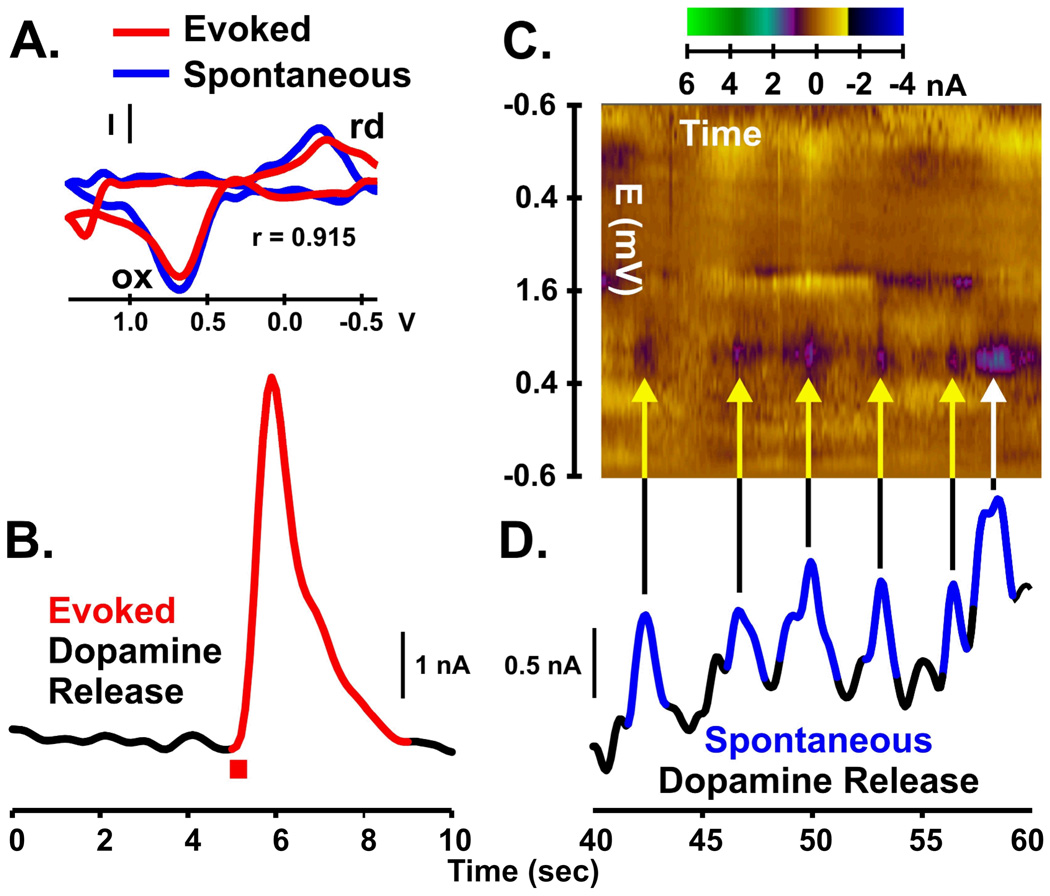
FIGURE 9.
Electrically evoked (A–B) and spontaneous (C–D) dopamine release measured in the striatum of a freely moving, 6-OHDA lesioned rat. Electrical stimulation of the medial forebrain bundle (60 Hz, 24 pulses, 125 µA; B, red bar) was used to evoke dopamine release. Background subtracted cyclic voltammogram (A, red line) for the electrically evoked signal (B, red line) is indicative of maximal dopamine oxidative current. Several spontaneous (non-electrically evoked) dopamine transients (D, blue lines) are shown in the same recording at a later time where voltammograms are plotted with respect to time in the form of a pseudo-color plot (C, time, x-axis; voltage, y-axis; current, z-axis). The predominant brown color represents baseline current levels, which is a “zeroing” produced by the subtraction procedure. Note that each spontaneous peak in trace D has corresponding features in the pseudo-color plot C, coincident in time (yellow arrows). These colors reflect current due to oxidation (ox) of dopamine to a quinone (purple) and reduction (rd) of the electroformed quinone back to dopamine (yellow). These colors also correspond to the ox and rd peaks of the single voltammogram (A, blue line) for the peak response of the last peak (white arrow) with excellent statistical similarity (r = 0.915) with the voltammogram for the evoked dopamine response. Collectively, the voltammogram defines the chemical signature of the transient and demonstrates that its origin is indeed dopamine.

