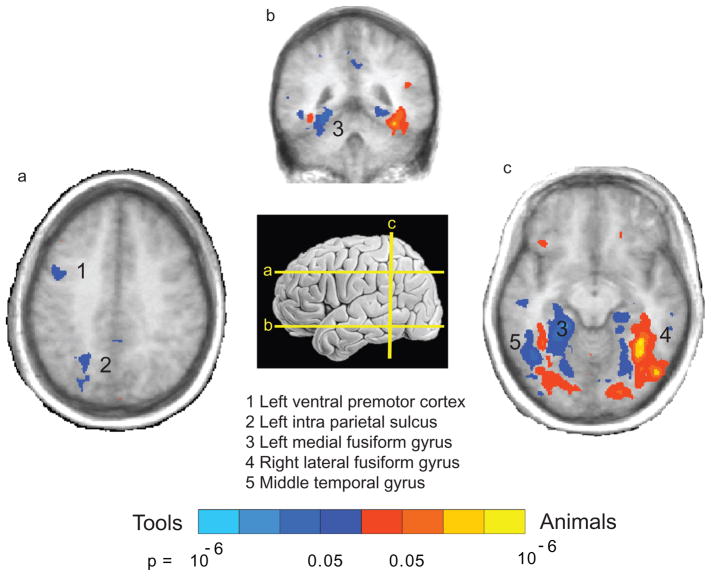
Figure 3.
Category-specific patterns of blood oxygen–level dependent (BOLD) responses in the healthy brain. A network of regions that are differentially activated for living animate things is in red; a network of regions that are differentially activated for nonliving things is in blue. Data from Chao et al. (2002); graphics provided by Alex Martin.

