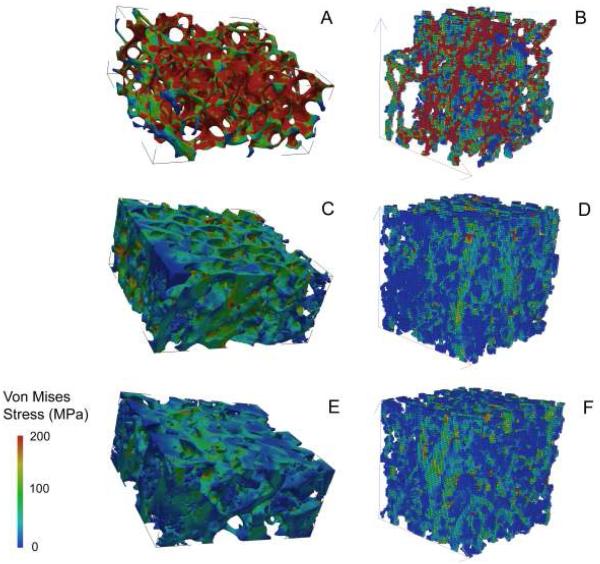
Figure 2.
Images showing von Mises stress were generated using μFE based on μCT of biopsies (A,C,E) and HR-pQCT (B,D,F) of the radius in a premenopausal woman with idiopathic osteoporosis (A and B), a normal premenopausal control (C and D), and a patient with hypoparathyroidism and unusually high bone density (E and F).

