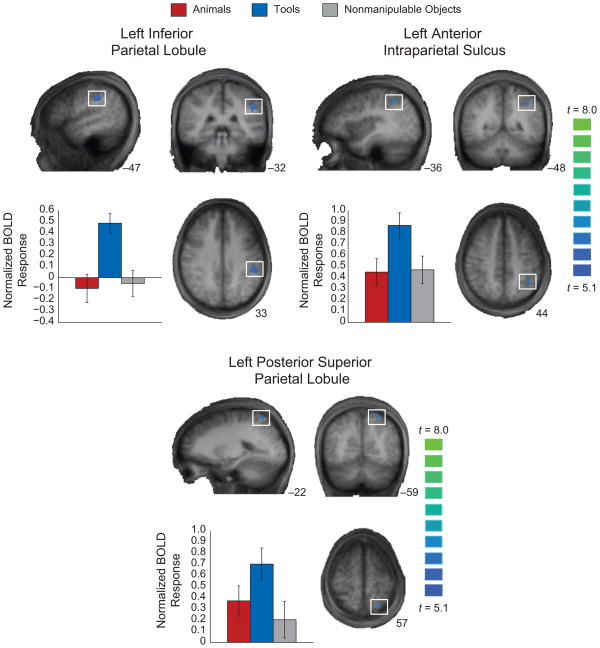
Fig. 1.
Differential blood-oxygen-level-dependent (BOLD) responses for tool stimuli in sighted participants viewing pictures. The brain images show three regions of interest (ROIs) within left parietal cortex. These ROIs were defined by contrasting tool stimuli against the other stimulus types (threshold of p < .05, corrected for false discovery rate for the whole brain volume). The bar graphs show BOLD estimates for the three stimulus types in each of these regions for the same data set; statistical tests were not performed over the data in these graphs, as those data are not independent of the ROI selection. Error bars reflect the standard errors of the mean. The locations and statistics for the effects are provided in the Results section. Talairach coordinates for the respective dimensions are shown adjacent to (bottom right of) the anatomical images. BOLD responses are plotted as normalized values (z scores).

