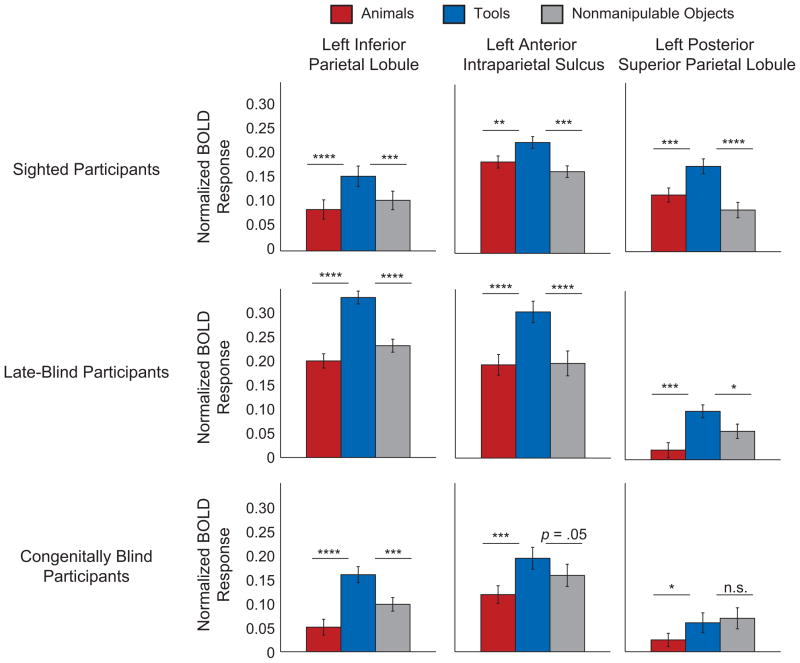
Fig. 2.
Mean blood-oxygen-level-dependent (BOLD) responses during the auditory size-judgment task as a function of stimulus type. Results are shown separately for each region of interest (defined on the basis of sighted participants viewing pictures; see Fig. 1) and participant group. Error bars reflect standard errors of the mean. Asterisks indicate a significant difference in BOLD responses (*p < .05, **p < .01, ***p < .001, ****p < .00001).

