
Fig. 2.
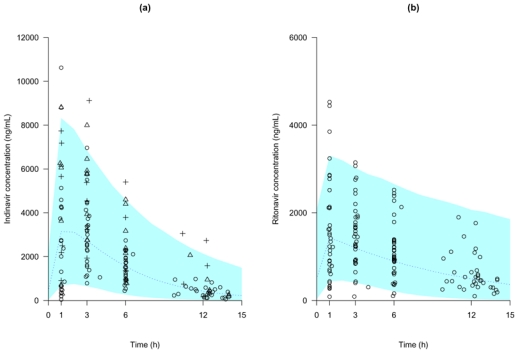
Visual predictive check of the basic population PK model: comparison between the median (continued line) and the 90th interval (colored area) predicted for 1000 simulated datasets and the observed concentrations of indinavir (a) and of ritonavir (b). In the indinavir plot the open circles correspond to an indinavir dose of 400 mg, the open triangles to 600 mg and the crosses to 800 mg