Fig. 3.

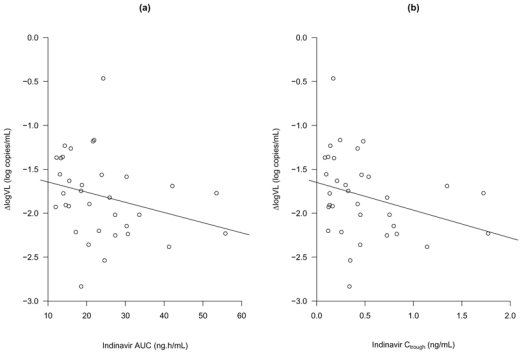
Differences in log viral load (ΔlogVL) observed between treatment initiation and week 2 versus area under the concentration-time curve (a) and trough plasma concentration of indinavir (b) predicted by the model

Differences in log viral load (ΔlogVL) observed between treatment initiation and week 2 versus area under the concentration-time curve (a) and trough plasma concentration of indinavir (b) predicted by the model