Fig. 4.

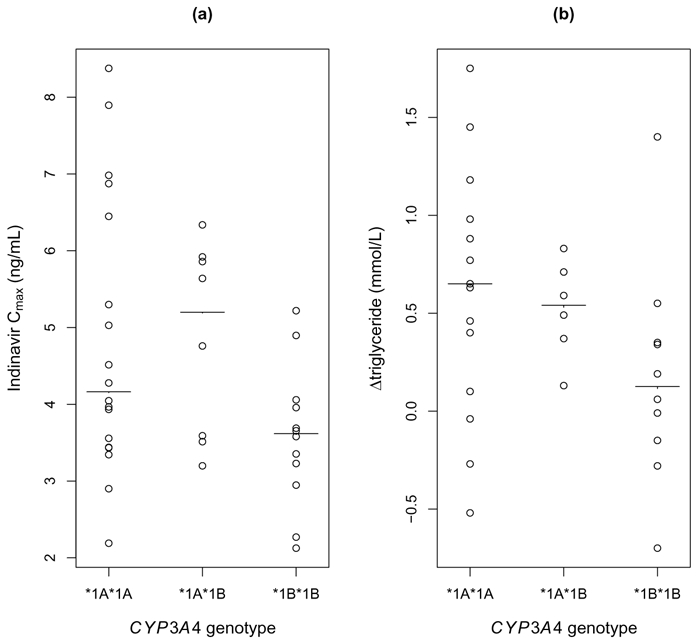
Peak indinavir concentrations predicted by the model (a) and differences in triglycerides (Δtriglyceride) 4 weeks before and after treatment initiation (b) versus CYP3A4 genotype. The solid-line represents the median in each group

Peak indinavir concentrations predicted by the model (a) and differences in triglycerides (Δtriglyceride) 4 weeks before and after treatment initiation (b) versus CYP3A4 genotype. The solid-line represents the median in each group