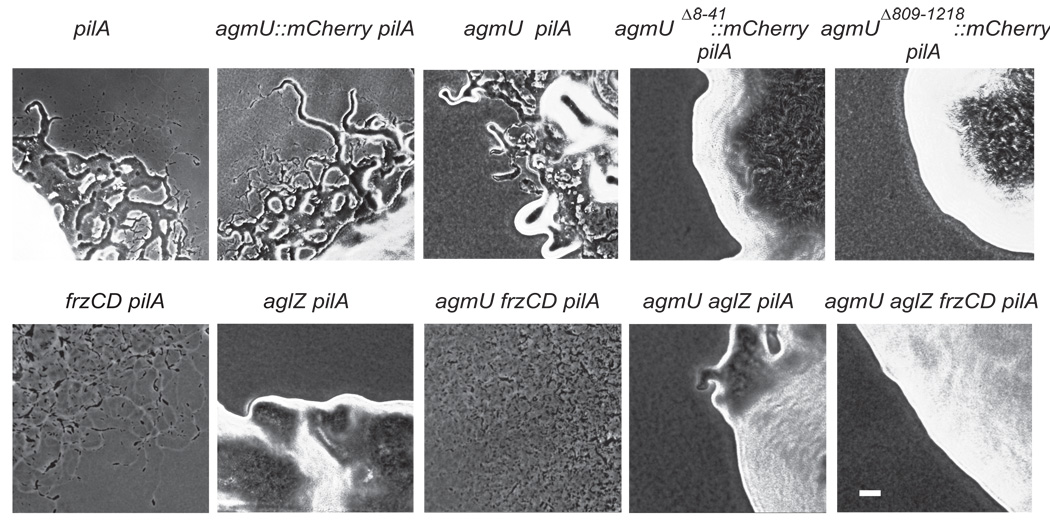
Figure 2. A-motility analysis of M xanthus strains DZ2 (wt), frzCD, aglZ and agmU mutants.
In the S− background (pilA), single cells swarming out from the edge of colonies on 1.5% agar (or agarose) were monitored as an indicator of A-motility (Hodgkin, 1979). Cells (10 µl), at a concentration of 4 × 10⁹ cfu ml−1, were spotted on CYE plates containing 1.5% (w/v) agar (or agarose), incubated at 32°C and photographed after 48 h with a WTI charge-coupled device (CCD)-72 camera, using a Nikon Labphot-2 microscope. Scale bar, 40 µm.

