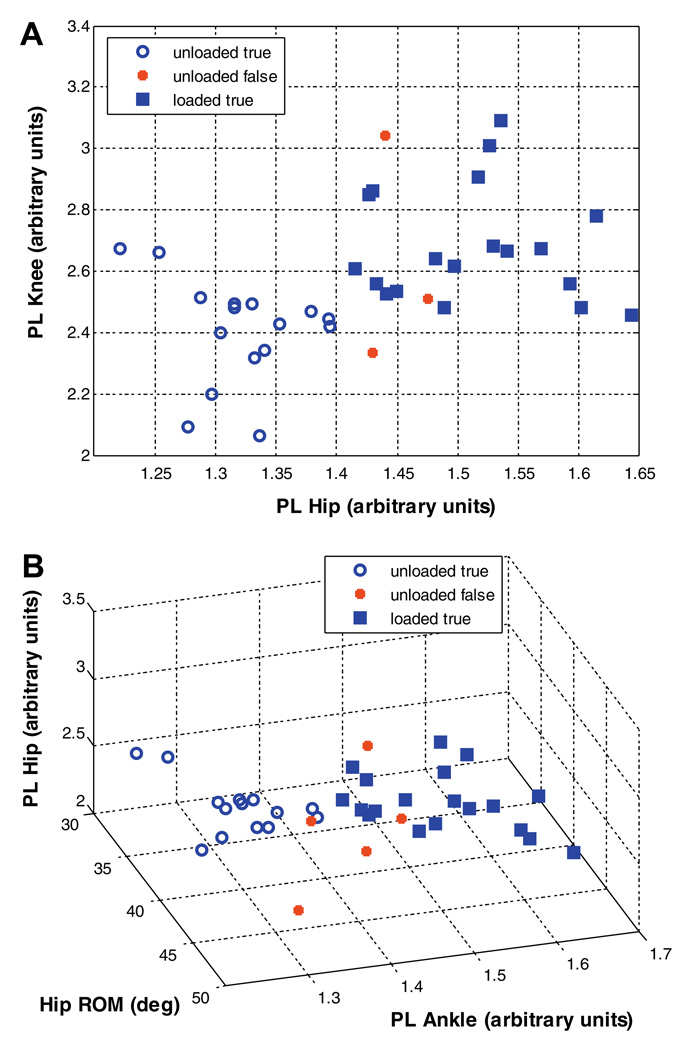
Fig. 3.
Scatter plots of load classification after linear discriminant analysis (LDA). (A) A 92.5% (37 out of 40) correct classification rate was achieved when using two path length variables. (B) A 87.5% (35 out of 40) correct classification rate was achieved when using three path length variables. True is the correct classification and false is the incorrect classification after linear discriminant analysis.

