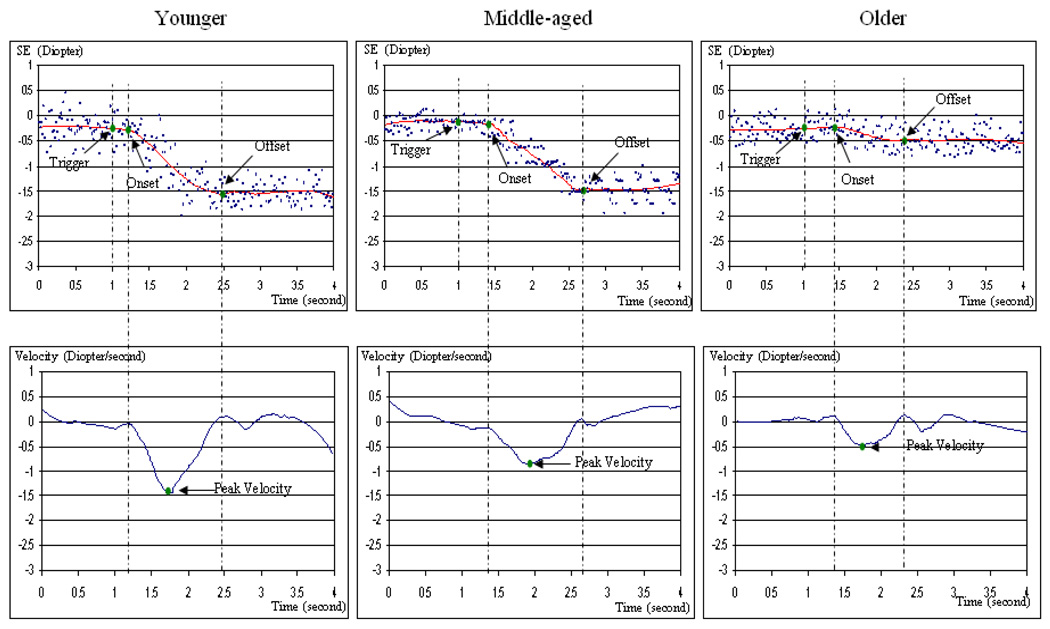
Figure 4.
Sample accommodation processes associated with different age groups, including the trigger, onset and offset points as defined by their velocity curves (SE = Spherical Equivalent). The fitted curves in the three upper graphs represent the time varying nature of accommodation from a far target to a near target as measured by SE.

