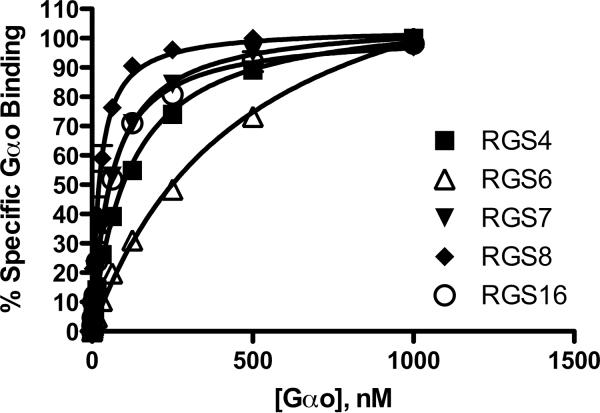
Figure 3.
Multiplexed measurement of RGS-Gαo protein-protein interaction. Increasing concentrations of fluorescently labeled Gαo were added to 10nM RGS on beads in the presence of AlF4− to determine total binding, and in the absence of AlF4− to determine the non-specific component. In these experiments, each RGS was coupled to an individual bead region, washed, and then the beads mixed together before being added to the test wells. Non-specific binding was subtracted from total to yield the % Specific Gαo bound to the RGS, (% Gαo bound in the presence of GDP-AlF4−as compared to GDP alone). In addition, non-specific binding was tested to each bead region to ensure no intrinsic differences existed. Typical non-specific binding was less than 10% total signal, except for RGS6, which had higher non-specific binding (approx. 15%) at saturating Gαo concentration. Each line on the graph is the average of at least 3 independent experiments (N=3), performed in duplicate, with error bars indicating the standard error of the mean (SEM).

