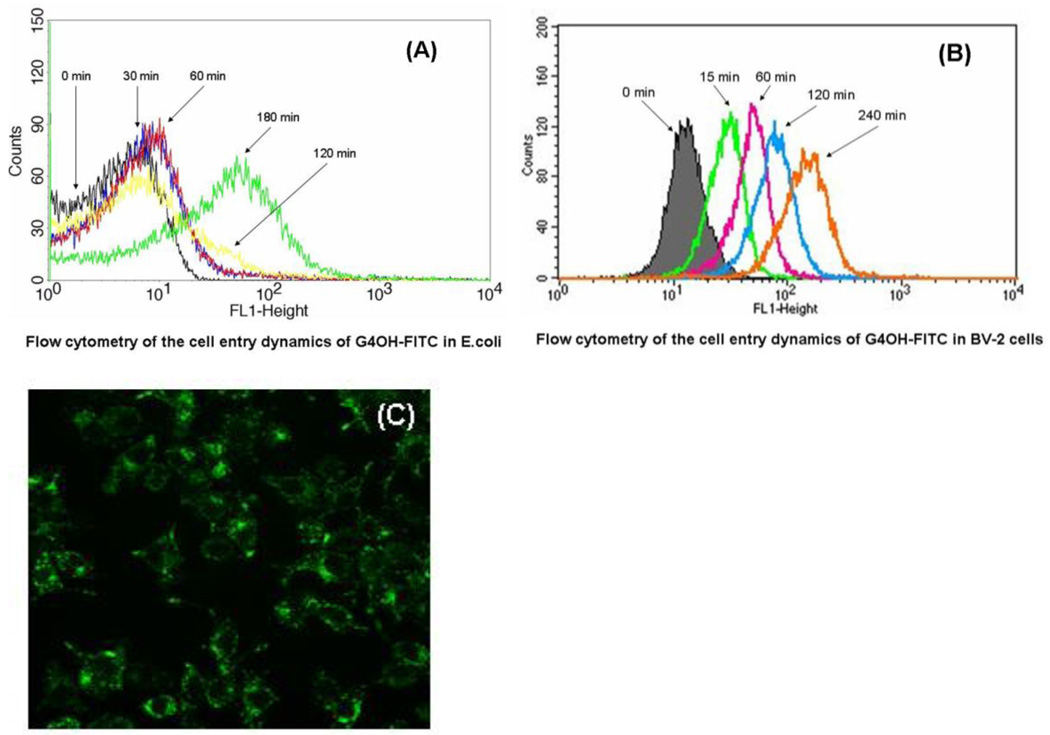
Fig. 7.
Flow cytometry of the cell entry dynamics of (A) G4-PAMAM-OH-FITC in E. coli and (B) BV-2 microglial cell line. The log of FITC absorption intensity (FL1-H on x-axis) is plotted against the number of cells (counts on y-axis). The maximum uptake of G4-PAMAM-OH-FITC in E. coli occurs at 3h. The rapid cellular uptake of G4-PAMAM-OH-FITC within 15 min in microglial cells is evident. The transport of conjugate into microglial cell increased with increasing time. Confocal microscopy images (400×) showed that G4-PAMAM-OH-FITC appeared to be mainly localized in the cytoplasm of BV-2 cells while the nucleus appeared to be relatively free of the presence of any fluorescence at this time point (C).

