
Figure 6.
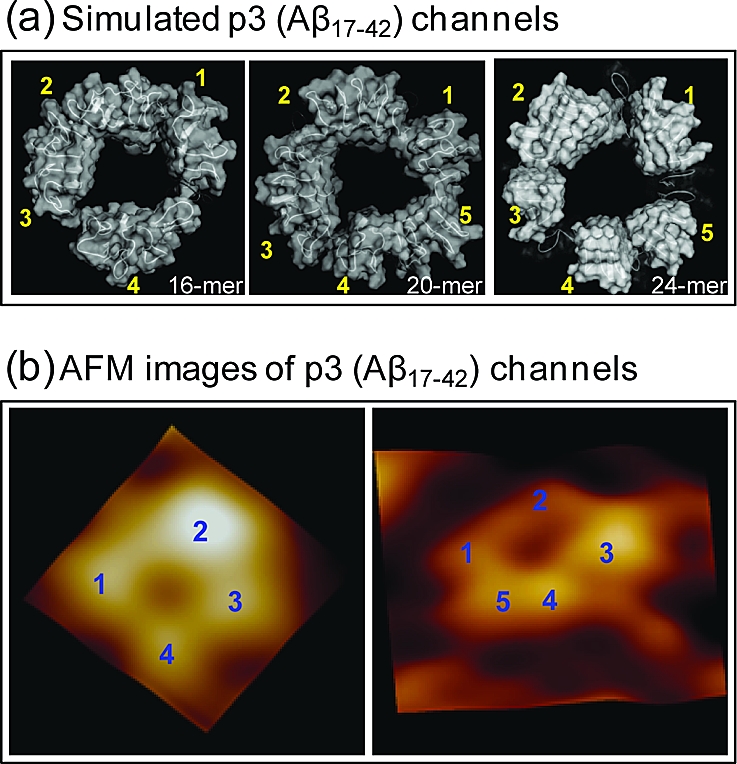
A side-by-side comparison between the computational and the experimental channels. (a) The simulated channel structures with highlighted subunits for the 16-, 20-, and 24-mer p3 (Aβ17−42) channels. The 16- and 20-mer structures were obtained from the simulations in the zwitterionic DOPC bilayer. The 24-mer structure was obtained from the anionic bilayer containing POPC and POPG at a molar ratio of 4:1. The averaged channels in the surface representation are shown in the view along the membrane normal. (b) AFM images of p3 (Aβ17−42) channels show four or five subunits consistent with the simulated channels. Image sizes are 15 × 15 nm2 and 23 × 23 nm2, respectively (Jang et al.,(27) Permission will be obtained.)