
Figure 7.
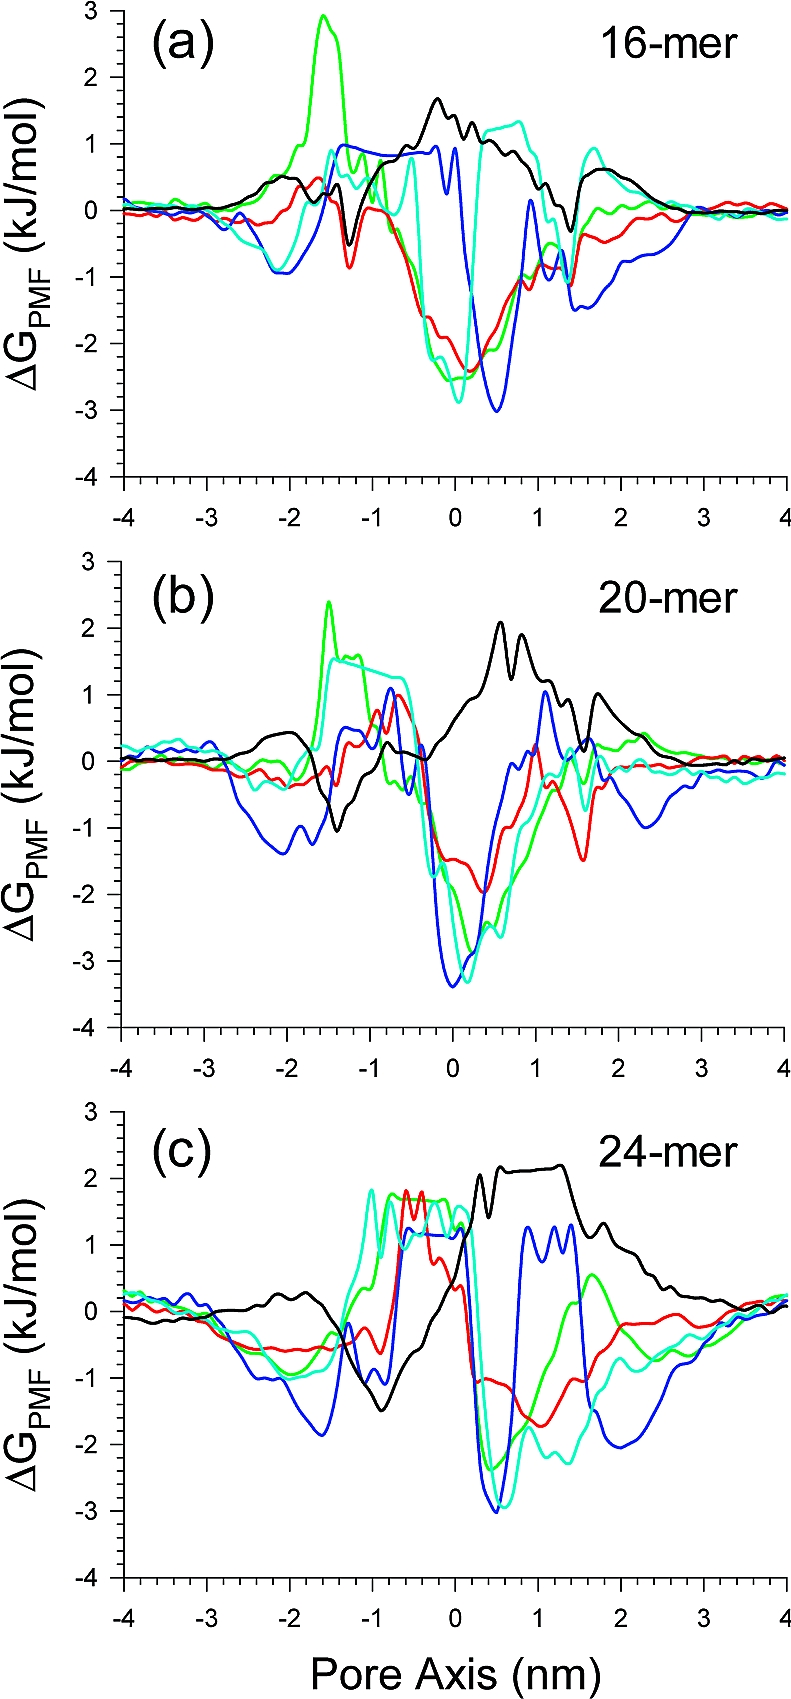
Potential of mean force (PMF), ΔGPMF, calculated using the equation ΔGPMF = −kBT ln(ρz/ρbulk), where kB is the Boltzmann constant, T is the simulation temperature, ρz is the ion density at the position z along the pore axis, and ρbulk is the ion density in the bulk region, representing the relative free energy profile for Mg2+ (green lines), K+ (red lines), Ca2+ (blue lines), Zn2+ (cyan lines), and Cl− (black lines) as a function of the distance along the pore center axis for the (a) 16-, (b) 20-, and (c) 24-mer p3 (Aβ17−42) channels. The PMF results for the 16- and 20-mers were obtained from the simulations in the zwitterionic DOPC bilayer. The PMF result for the 24-mer was obtained from the anionic bilayer containing POPC and POPG at a molar ratio of 4:1.