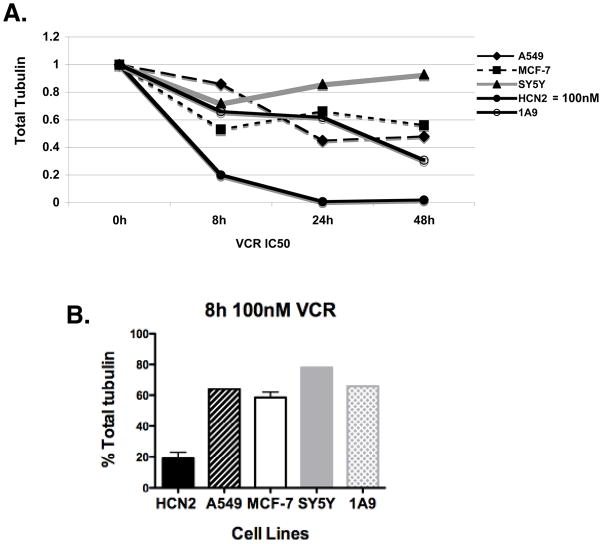
Figure 4. VCR treatment decreases tubulin levels in cancer cell lines but not to the levels seen in neural cells.
4A: Cancer cells (A549, MCF-7, SY5Y and 1A9) were treated with IC50 concentrations of VCR (Supplementary Table 1) for 8h, 24h and 48h compared to 100 nM VCR treatment in HCN2 cells. Total α-tubulin levels in cancer cells compared to HCN2 cells are shown. 4B: Total α-tubulin levels in cancer cells are plotted and compared to HCN2 cells when treated for 8h with 100 nM VCR.

