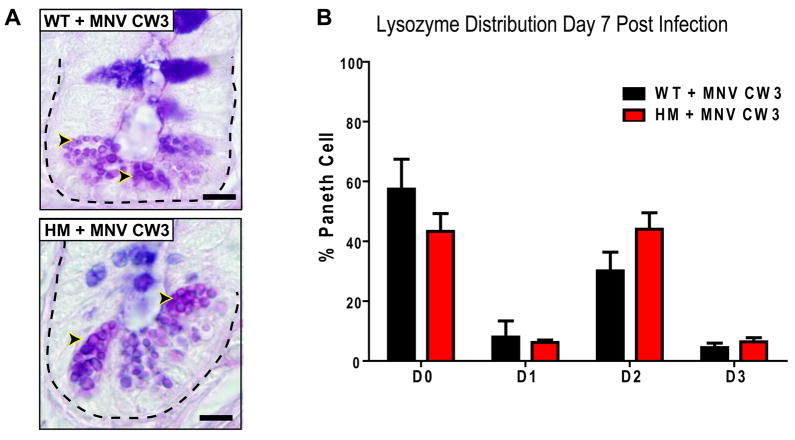
Figure 2. Properties of MNV associated with Paneth cell abnormalities in Atg16L1 mutant mice.
(A) Light microscopy of ileal sections stained with PAS-alcian blue of WT and Atg16L1HM mice 7 days post infection with 3×10⁷ pfu of MNV CW3 (n = 6 mice/genotype). Dotted line denotes crypt unit and arrowheads indicate Paneth cell granules. Scale bar represents 10 μm.
(B) Number of Paneth cells displaying abnormal lysozyme distribution from WT and Atg16L1HM mice in (A) (n > 6100 cells from 3 mice/condition, mean +/−SEM).
See also Figure S2.

