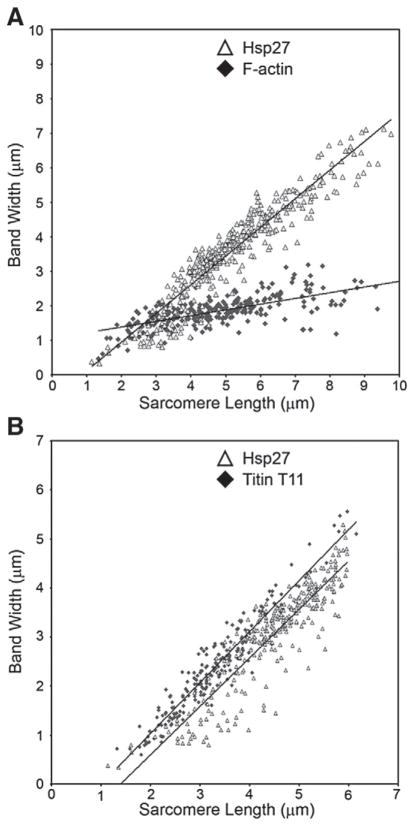
Fig. 3.
Comparison of Hsp27 band doublet width with F-actin band length and T11 binding epitope separation in stretched myofibrils. (A) Data points are doublet band separation (Y axis) for Hsp27 (empty triangle) and F-actin band length (solid diamond) plotted against the length of associated sarcomere (X-axis). Slopes of the regression lines are significantly different (p≤0.05). (B) Separation of Hsp27 band doublets (empty triangle) and the titin T11 epitope (solid diamond) plotted against the length of associated sarcomeres. Slopes of the two regression lines are not statistically different (p>0.05). Fig. 3A shows measurements from 249 sarcomeres for Hsp27 and F-actin obtained from preparations of three hearts. Fig. 3B shows measurements from 391 sarcomeres probed for Hsp27 and 221 sarcomeres probed with T11 antibody obtained from preparations of three hearts.

