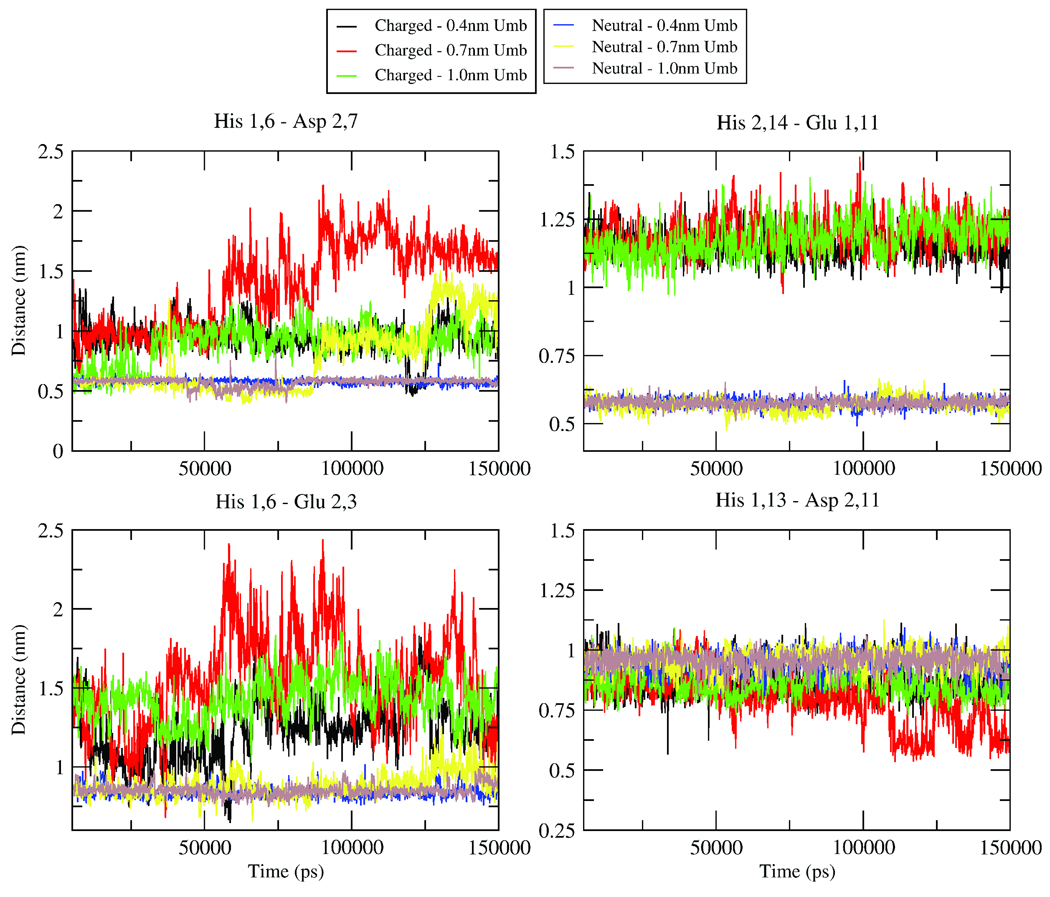
FIGURE 5.
Distance measurements between the centers of mass of indicated residues for either charged or neutral Hairpin dimer in solution. Distances were calculated within the 0.4nm, 0.7nm and 1.0nm umbrellas to show that the explained phenomenona were not due to a specific structure or initial condition. Amino acids are listed with the monomer number followed by the residue number on that monomer. For example, Asp2,7 is actually Asp7 on the second monomer. The plots begin at 5000ps to indicate that the first 5ns were considered equilibration.

