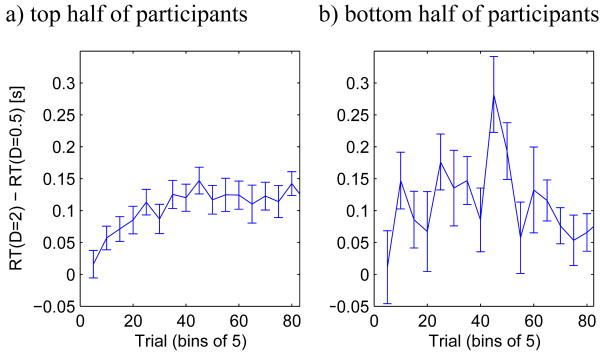
Figure 10.
Changes in participants' performance within single blocks of trials. In all panels horizontal axes show the trial number within a block – each point corresponds to a bin of 5 trials. Vertical axis shows the difference in the mean reaction time (RT) between delay condition D = 2, and D = 0.5 averaged over: 5 trials in a given bin and both difficulty conditions. Error bars indicate standard error. Panel a shows data averaged across participants of Experiments 1 and 2 with reward scores higher than the median for each of experiment, and panel b shows data averaged across participants with reward scores lower than the median.

