Figure 3.
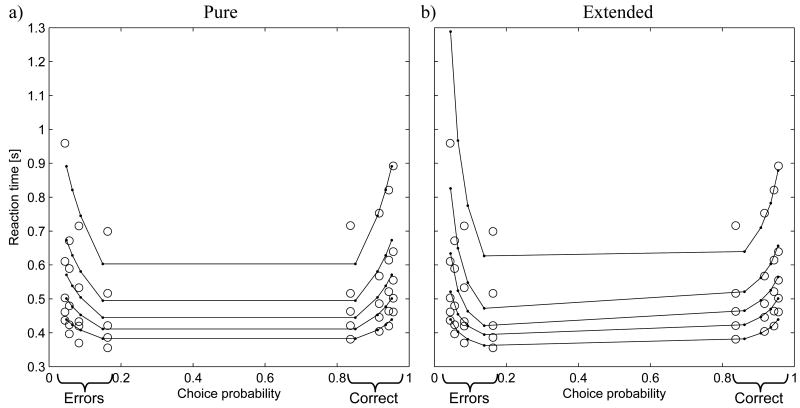
Quantile probability plots showing the fits of the pure (a) and the extended (b) drift diffusion model (DDM) to behavioural data from a sample participant. Open circles correspond to the behavioural data. The horizontal axes indicate the probability of error in the left parts of the panels, and probability of correct choice in the right parts (see labels on x-axes). In each part, the four columns of circles correspond to the four delay conditions in the experiment. In each column of circles, the vertical positions of the five circles indicate the quantiles of reaction times. Small filled circles visualise the corresponding predictions for the DDM. These are connected by lines to make the patterns they create more visible. For clarity, error bars with confidence intervals for quantiles of reaction times are not shown here. They are plotted for the same participant in Figure 5 of Bogacz et al. (2006), which shows that the confidence intervals are very large for the error trials (up to 1.48s for the 0.9 quantile in D=0.5, Dp=1.5 condition) because of the small number of such trials. The estimated parameters of the models (for noise parameter fixed at c=0.1): a) pure DDM: T0=0.346, A=0.219, z1=0.0398, z2=0.0535, z3=0.0610, z4=0.0682; b) extended DDM: T0= 0.372, st=0.084, mA=0.344, sA=0.152, sx=0.044, z1=0.0503, z2=0.0592, z3=0.0687, z4=0.0816.

