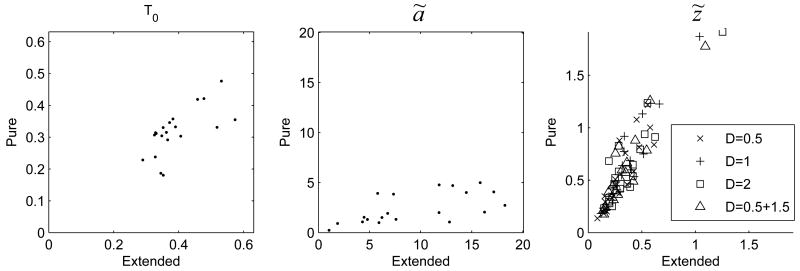
Figure 4.
Comparison of parameters T0, ã and z̃ estimated by fitting pure (vertical axes) and extended (horizontal axes) drift diffusion model. In the left and the central panels dots correspond to individual participants; in the right panel different experimental delay conditions are indicated by different symbols (see legend).

