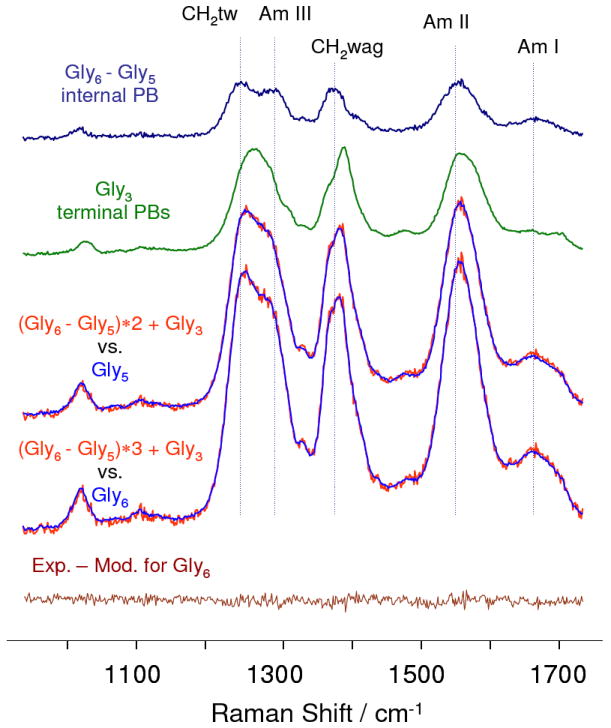
Figure 1.

204 nm UVRR spectra of oligoglycines in aqueous solutions containing 0.5 M LiClO4, at neutral pH. The gly6-gly5 difference spectrum approximates the spectrum of an internal peptide bond, while that of gly3 approximates that of the two terminal peptide bonds. This is demonstrated by the fact that the summation of these spectra accurately model gly5 and gly6 spectra as demonstrated by the lack of features in the bottom gly6 difference spectrum between the experimental and modeled spectra. All the UVRRS were scaled relative to the internal standard, perchlorate 932 cm-1 band (not shown).
