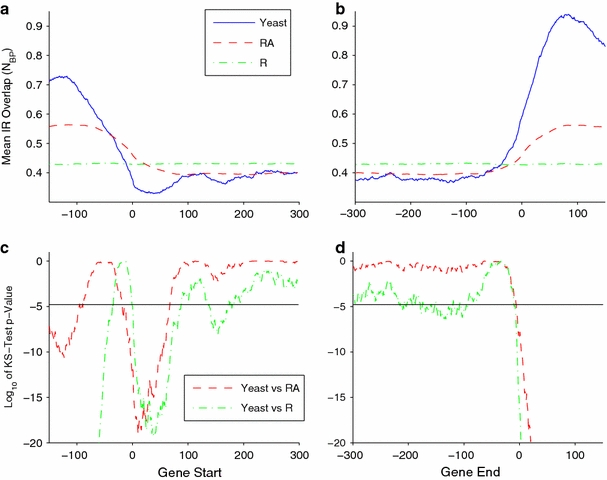
Fig. 10.

The mean overlap number N bp is shown for 3,832 genes aligned at their start (a), and stop positions (b). The results for the S. cerevisiae genome are shown in blue, while those for the RA- and R-genomes are in red and green, respectively. We compared the distributions at each position using the Kolmogorov–Smirnov test. The p values assessing statistical significance found this way at each position are plotted logarithmically in parts (c) and (d). The threshold for significance is shown as a horizontal line in each case. We note that significance can occur through either enrichment or paucity relative to random. This shows a significant enrichment of IRs in the 5′ and 3′ flanks of genes, with greater enrichment in the downstream, 3′ flanks. Within coding regions IRs occur at rates consistent with random, given their base composition. Within the first 80 bp after the gene start there are significantly fewer IRs than expected at random
