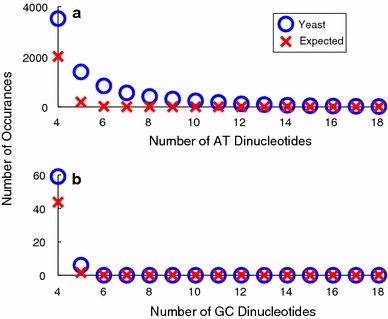
Fig. 4.

The numbers of ApT and TpA dinucleotide repeats in the S. cerevisiae genome are shown in part a as a function of repeat length. Part b shows the corresponding data for GpC and CpG dinucleotides. Here, the S. cerevisiae genome is represented by blue circles while the average numbers in the RA randomizations are shown as red x’s
