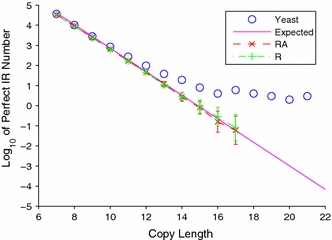
Fig. 6.

The number of perfect inverted repeats is plotted as a function of copy length in semilog coordinates. The data for the S. cerevisiae genome are shown in blue, while the means for the R- and the RA-randomizations are shown in green and red, respectively, with error bars corresponding to one standard deviation. The theoretically calculated expected numbers for a genome the base composition of which is 40% C+G are shown in magenta. The S. cerevisiae genome is significantly enriched in perfect inverted repeats for every copy length
