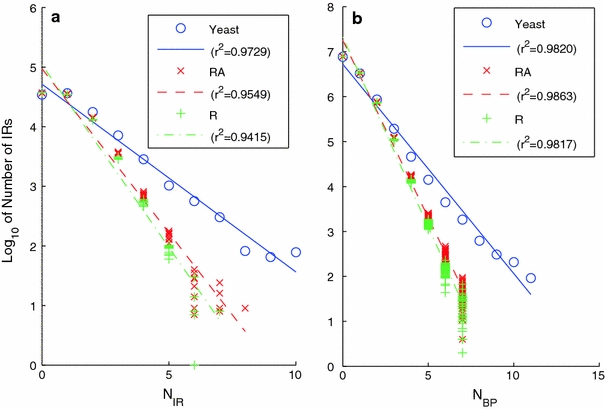
Fig. 8.

Part a shows the number of inverted repeats that are overlapped by N IR others, together with regression lines, plotted for the S. cerevisiae (blue), RA (red), and R (green) genomes. Part b shows the number N bp of distinct inverted repeats that overlap a given base pair. Both plots are presented in semilog coordinates. There is significant clustering of IRs in the S. cerevisiae genome relative to random, as shown by the larger overlap numbers it attains
