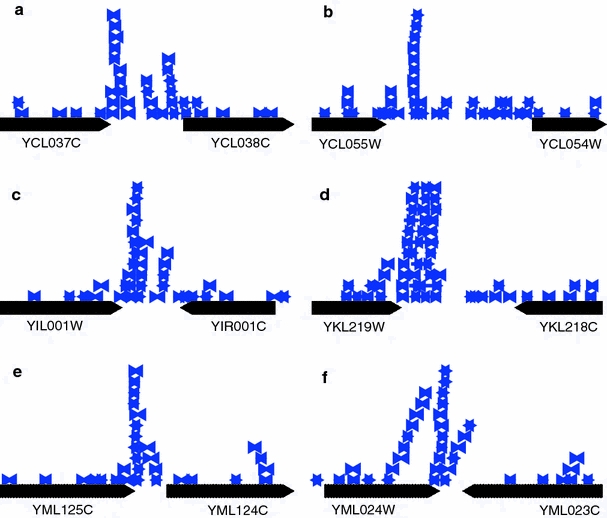
Fig. 9.

The six regions of the S. cerevisiae genome are shown where the highest levels of IR overlap are attained. Here IRs are represented by blue arrows, one arrow for each copy, pointing toward the center of symmetry. The flanking genes are shown in black with the arrow indicating transcriptional direction. Regions (a–b), (c), (d), (e–f) are located on chromosomes 3, 9, 11, and 13 respectively
