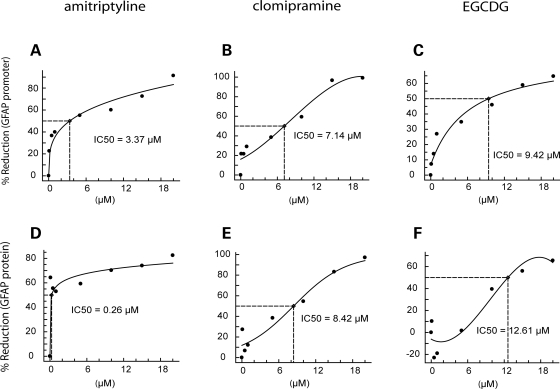
Figure 2.
Dose–response curves for amitriptyline, clomipramine and EGCDG evaluated for percent reduction in GFAP promoter (top row) or protein levels (bottom row). Astrocytes from GFAP-luciferase transgenic mice were exposed to each compound at 0–20 µm for 10 days. IC50s were calculated from fitted curves (see Materials and Methods). Toxicity was observed for all three compounds at the highest dose, 20 µm. Each point represents the mean of triplicate wells.

