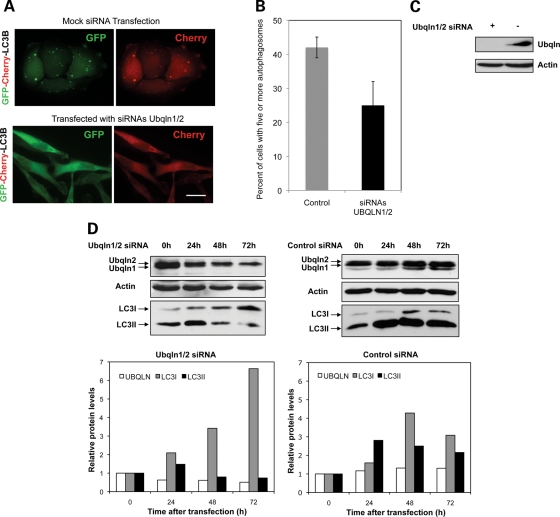
Figure 3.
Knockdown of ubiquilin inhibits autophagosome formation and maturation of LC3 protein. (A–C) HeLa cells were either mock transfected or transfected with siRNAs to specifically knockdown ubiquilin-1 and -2 proteins and 24 h later they were both re-transfected with cDNA encoding mCherry-GFP-LC3. Twenty hours later, the cells were fixed and the percent of GFP transfected cells that displayed five or more GFP puncta was quantified. (A) Representative images of cells showing knockdown of ubiquilin reduces autophagosome formation as measured using the mCherry-GFP-LC3 reporter. Bar, 10 µm. (B) Graphs of the quantification of cells with autophagosomes described in (A) obtained from three independent experiments. The graphs in this and subsequent figures show the mean and the error bars show the standard deviation. (C) Immunoblots showing effective knockdown of ubiquilin proteins in the cultures after 44 h of knockdown (+ and − indicate the cells that were transfected with siRNAs to knockdown ubiquilin-1 and -2 proteins, or which were mock-transfected, respectively). (D) Cultures of HeLa cells were transfected with siRNAs to knockdown ubiquilin-1 and -2 proteins or with negative control siRNAs and lysates were collected 0, 24, 48 and 72 h later. The lysates containing equal amounts of protein were immunoblotted with antibodies to detect ubiquilin, actin and LC3 proteins. Also shown are graphs of the quantification of the ubiquilin and LC3-I and -II bands. Similar results were seen in two separate experiments.

