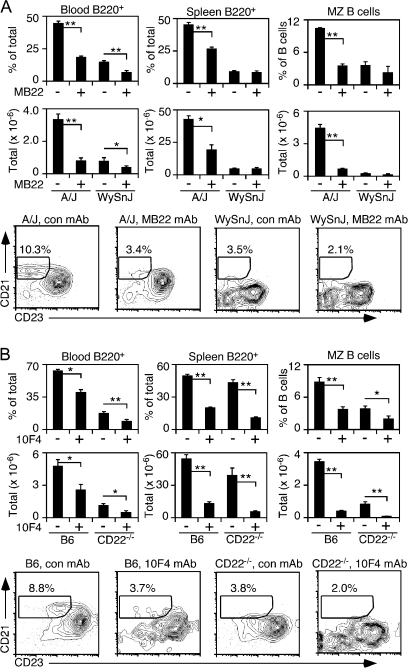
Fig. 2.
Complementary CD22 and BLyS–BR3 survival signals regulate B-cell homeostasis in BR3 mutant (WySnJ) and CD22−/− mice. (A) Circulating and spleen B-cell frequencies and numbers in A/WySnJ and A/J mice following CD22 blockade. (B) Circulating and spleen B-cell frequencies and numbers in CD22−/− and C57BL/6 mice following anti-BLyS mAb treatment. (A and B) All mice were treated with MB22-10, anti-BLyS or control (con) mAb (100 μg) on days 0 and 5. Frequencies and total numbers of B220+ lymphocytes were determined on day 10, as in Fig. 1. Bar graphs show the means (±SEM) for three mice per treatment group and representative contour plots indicate the CD21hiCD23− gate used to identify splenic MZ B cells in each treatment group. Significant differences relative to control mAb treatment are indicated; *P ≤ 0.05; **P ≤ 0.01.

