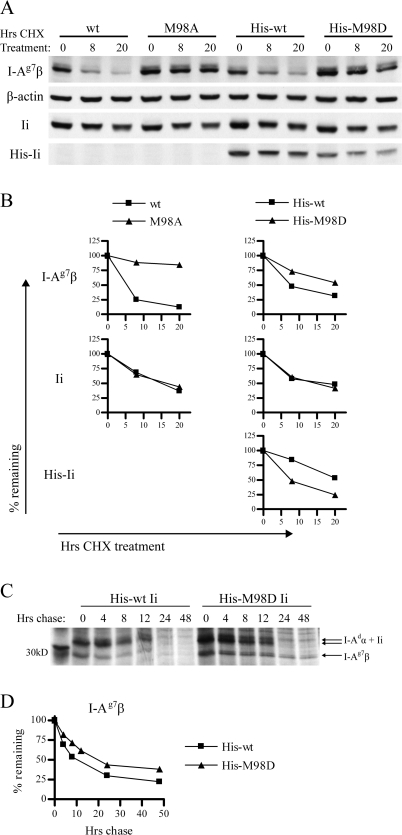
Fig. 4.
Increased affinity of CLIP for I-Ag7 increases survival time of I-Ag7 and decreases survival time of Ii. (A) 3A5.g7 cells stably expressing wt or mutant Ii were treated with CHX to block de novo protein synthesis. The level of surviving I-Ag7, actin, Ii and His-Ii was assessed by western blot at the indicated time points (using 10-2.16, anti-actin, In-1 and anti-Tetra-His primary antibodies, respectively). Samples are normalized to represent the same number of live cell equivalents (c.eq.) per lane. At the chosen dose of CHX (10 μg ml−1), 3A5 cells ceased to expand but retained >90% viability. Untreated cells expanded exponentially and maintained constant levels of I-Ag7 (per live c.eq.) over the period of observation (data not shown). One representative experiment of two is shown. Each experiment was performed with duplicate gels (one gel with high c.eq. and one gel with low c.eq.) to ensure that detection was in the quantitative range of the assay for each of the four antibodies. Shown: 2x10⁶ c.eq. per lane for I-Ag7β and His-Ii blots and 0.4x10⁶c.eq. per lane from the same samples for actin and total Ii blots. Not shown: the effect of His-M98E on turnover of I-Ag7β and His-Ii was slightly reduced compared with that of His-M98D. (B) Densitometry of the bands shown in A: band intensity was normalized to β-actin band intensity at the same time point and then expressed as % remaining compared with the 0-h time point to illustrate rate of turnover. (C) 3A5.g7 cells stably transfected with His-wt or His-M98D Ii were starved (1 h), labeled with [35S] cysteine and methionine (1 h) and chased for the indicated times. I-Ag7 (I-Adα/I-Ag7β) was immunoprecipitated with 10-2.16. Samples were normalized for starting cell number at time 0 and analyzed by SDS–PAGE. (D) Densitometry of the I-Ag7β bands in C: band intensity was normalized to the 0-h time point from the same sample (shown as % remaining) to illustrate turnover. (12-h time point is omitted for the His-wt Ii series due to distortion of the gel at this lane.)

