FIGURE 4.
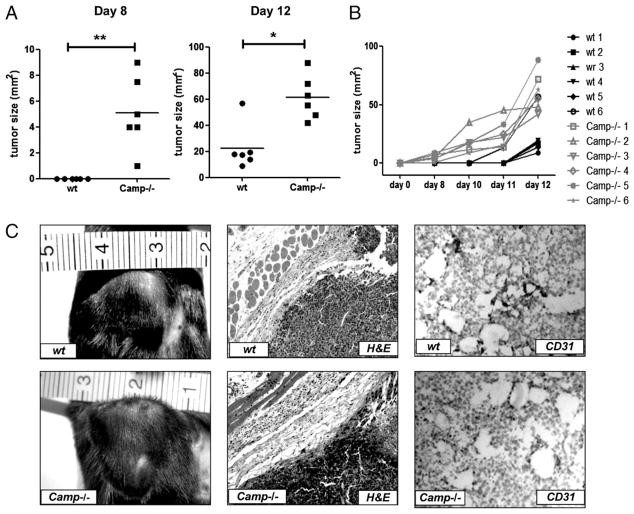
Accelerated B16 tumor growth in Camp−/− mice. Approximately 1 × 10⁶ B16.F10 cells/mouse were inoculated s.c. in the hind flank of syngenic Camp−/− and wt mice. Mice were observed for tumor development, and tumors were measured with a caliber, and sizes in mm2 were calculated as described in Materials and Methods. A, Tumor formation occurred earlier and tumor sizes were larger in Camp−/− mice (n = 6) compared with wt controls (n = 6). Tumor sizes are plotted for day 8 and day 12 after tumor challenge, and each dot represents the size of one individual mouse. B, Tumor sizes and tumor development for individual mice are shown. *p < 0.05; **p < 0.01. Results are representative of three independent experiments. C, Images and histological evaluation of tumors in Camp−/− and wt mice. Immunohistochemistry reveals similar inflammation and degree of vascularization. Original magnification ×100 for H&E staining; ×200 for CD31 staining.

