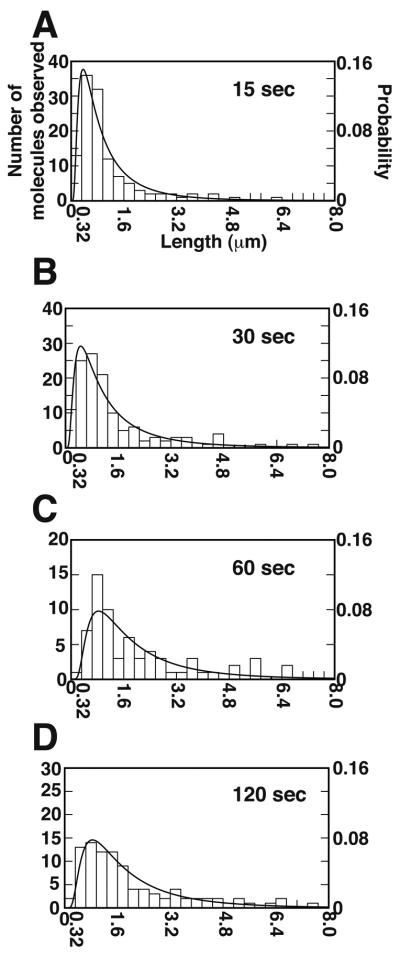
Figure 3.
DNA loop size distributions after different flow interruption durations. Panels A, B, C and D show the results with the buffer flow interruption times of 15, 30, 60 and 120 second, respectively. All data are fitted to an inverse Gaussian distribution with the fitting parameters as described in Table S3.

