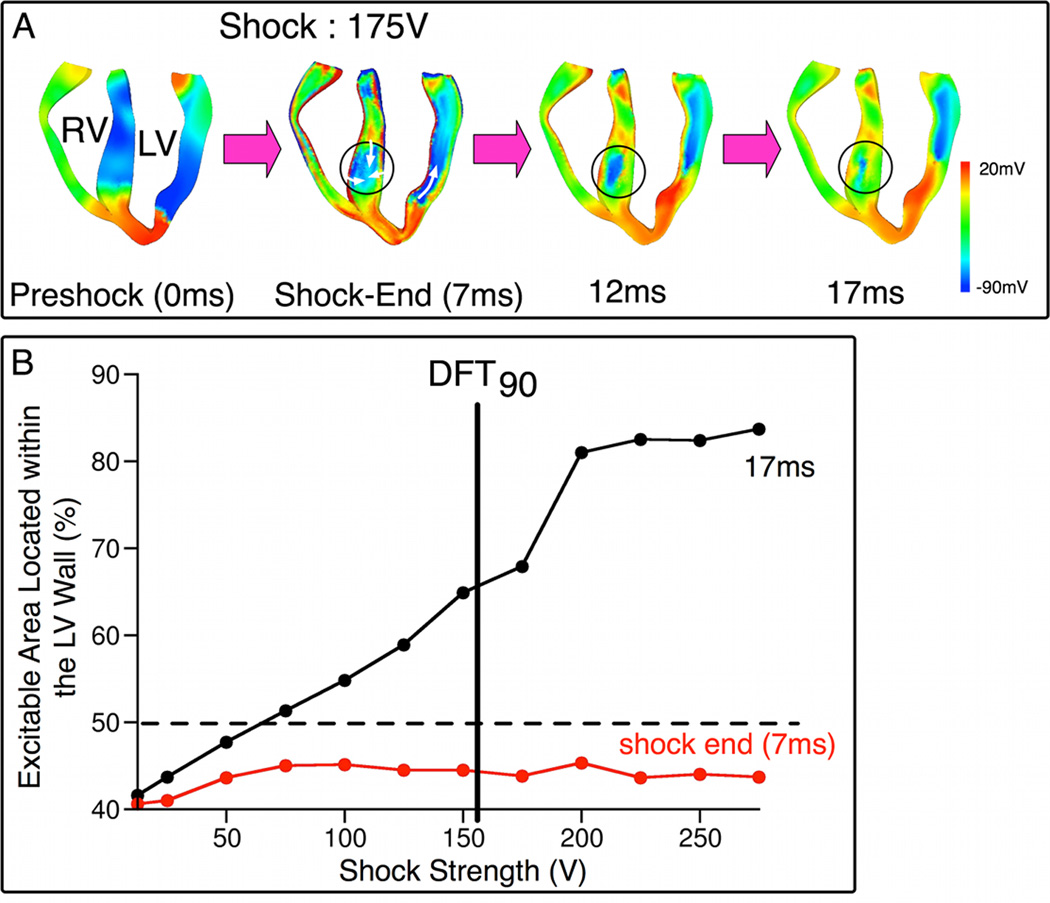
Fig. 2. Main postshock excitable area is in the LV wall.
A, Vm maps in apex-to-base cross-sections following 175-V shock. Time is counted from shock onset. Regions within circles are septal excitable areas. White arrows denote direction of propagation. B, Percentage of total excitable volume in the LV wall as a function of SS at shock-end (7ms, red) and 17ms postshock (black).

