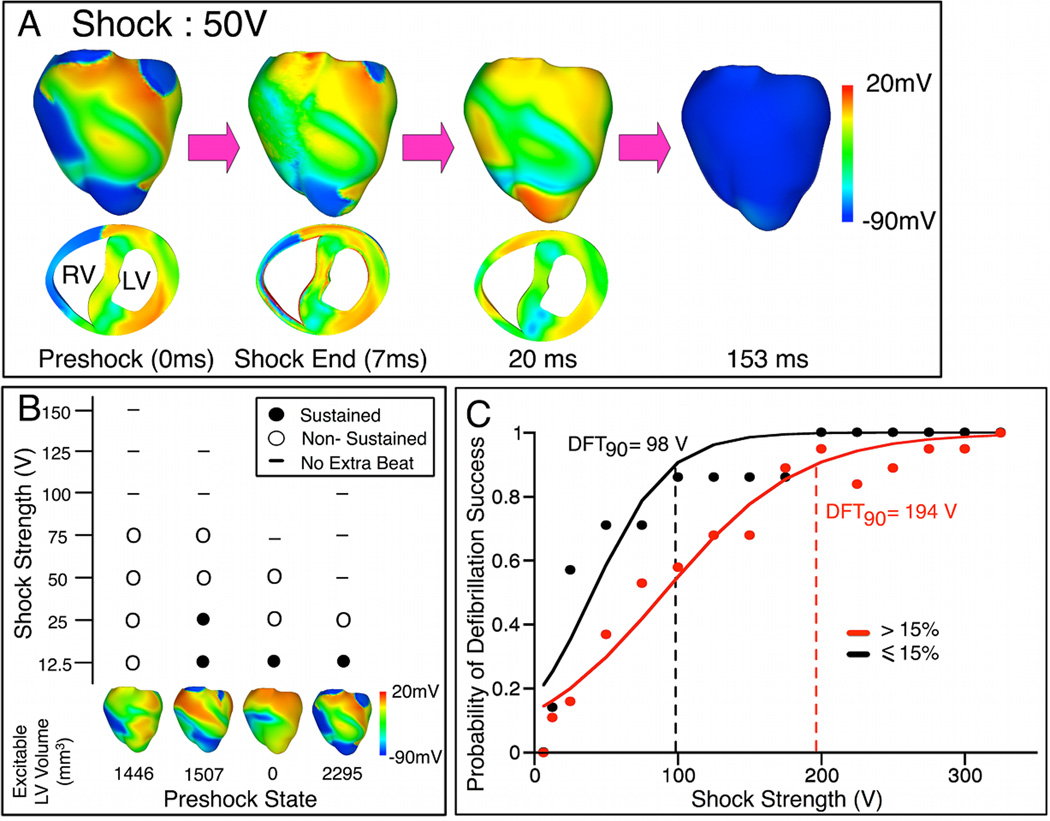
Fig. 3. Extent of LV preshock excitable area affects shock outcome.
A, Vm maps following 50-V shock delivered when LV was mostly refractory. B, Shock outcome grid for four preshock states, each with <15% excitable tissue in LV wall. Shock outcome is denoted by symbols in the grid. C, Dose-response curves for episodes of shock delivery at preshock states with >15% (red) and ≤15% (black) excitable tissue in LV wall.

