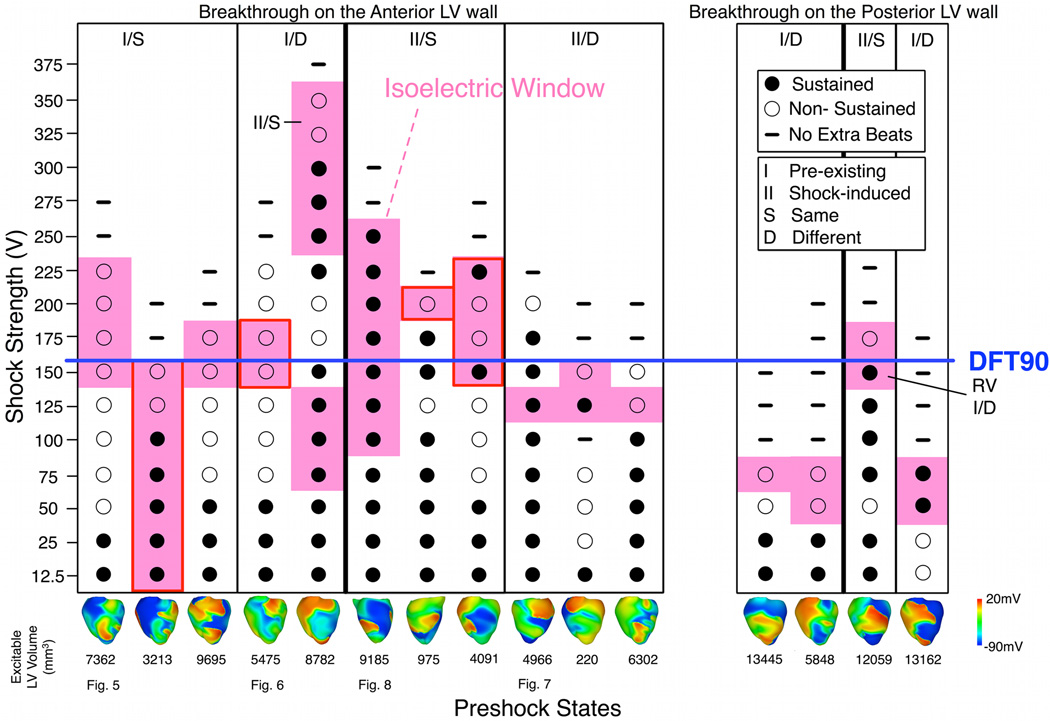
Fig. 4. Shock outcome grid.
Pink denotes fibrillation re-initiation episodes following IW. Images at bottom represent epicardial preshock Vm maps. Breakthroughs following IW are on LV anterior (left) and posterior (right) epicardium, with one exception on RV epicardium (marked by “RV”). Red boxes indicate breakthroughs near LV apex. Episodes with the same postshock behavior as a function of SS (S or D) and initiating PA origin (I or II, denoting pre-existing or shock-induced PA, respectively) are grouped into columns. Labels at bottom indicate figures in which the corresponding behavior is examined.

