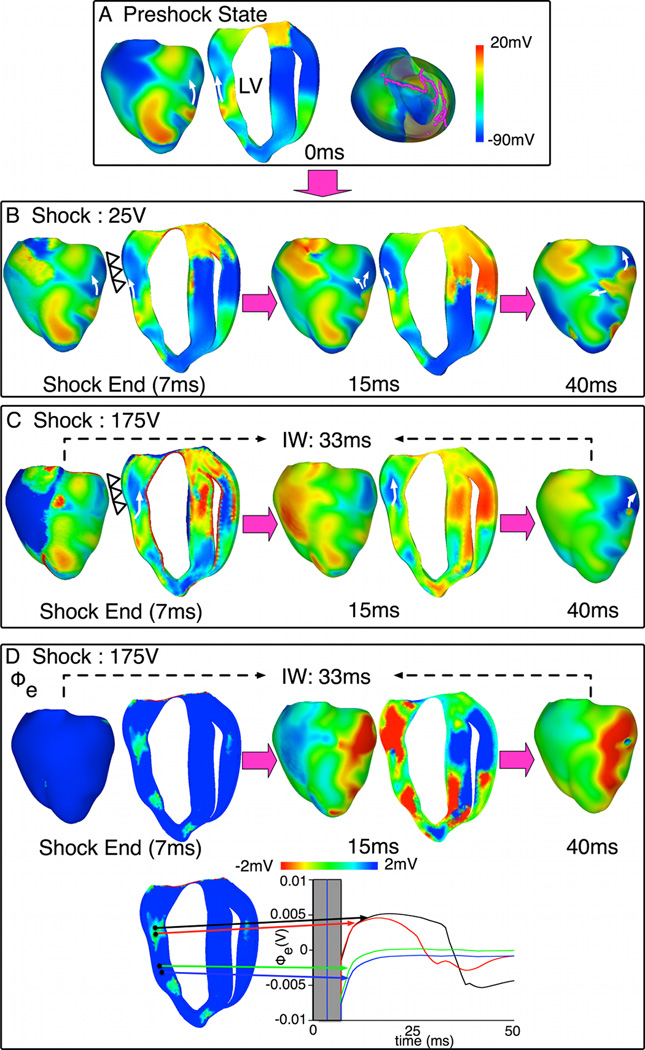
Fig. 5. Behavior S with pre-existing initiating PA.
A. Preshock Vm maps with filaments in pink. B–C. Shock-induced response and propagation of Pas following 25-V and 175-V shocks. Open triangles mark LV epicardium that is refractory after the 175-V shock. White arrows denote propagation direction. Transmural apex-to-base maps are shown larger than epicardial maps to better show intramural propagation. D. Epicardial and transmural Φe maps (top) and Φe traces (bottom) within (black, red) and outside (green, blue) the tunnel following the 175-V shock.

