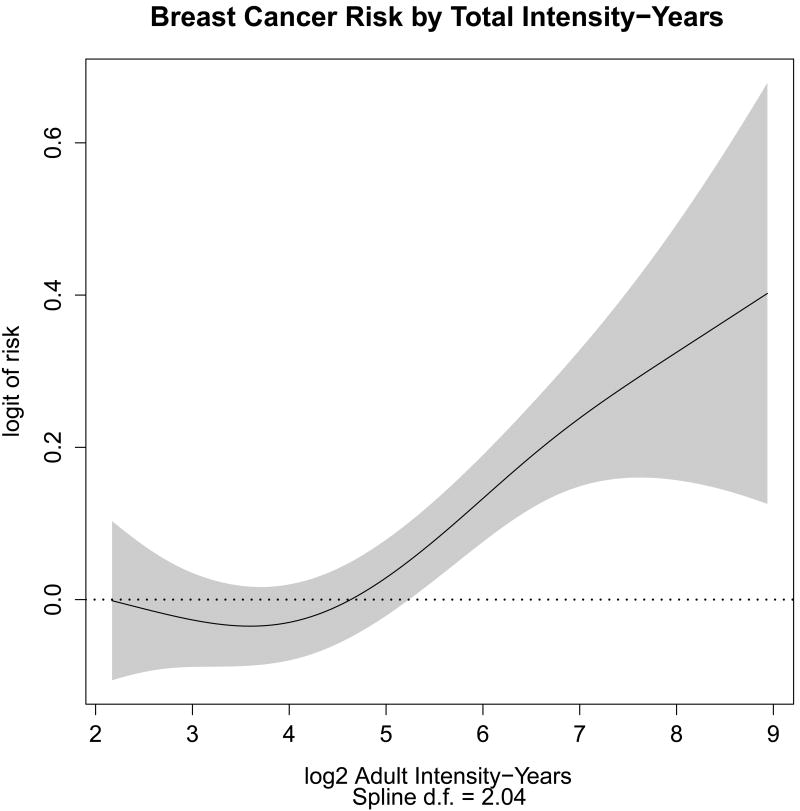
Figure 2.
Smoothing spline representation of the dose response curve for total intensity-years in adults from all sources. The curve represents the logit of relative risk as a function of dose, was calculated using a binomial Generalized Additive Model, and arbitrarily translated so that the logit corresponding to the lowest exposure is zero. The subjects are restricted to those with a Intensity-years score from all sources exceeding 4. The shaded area represents the point wise 95% confidence interval, and the dotted line shows response of zero.

