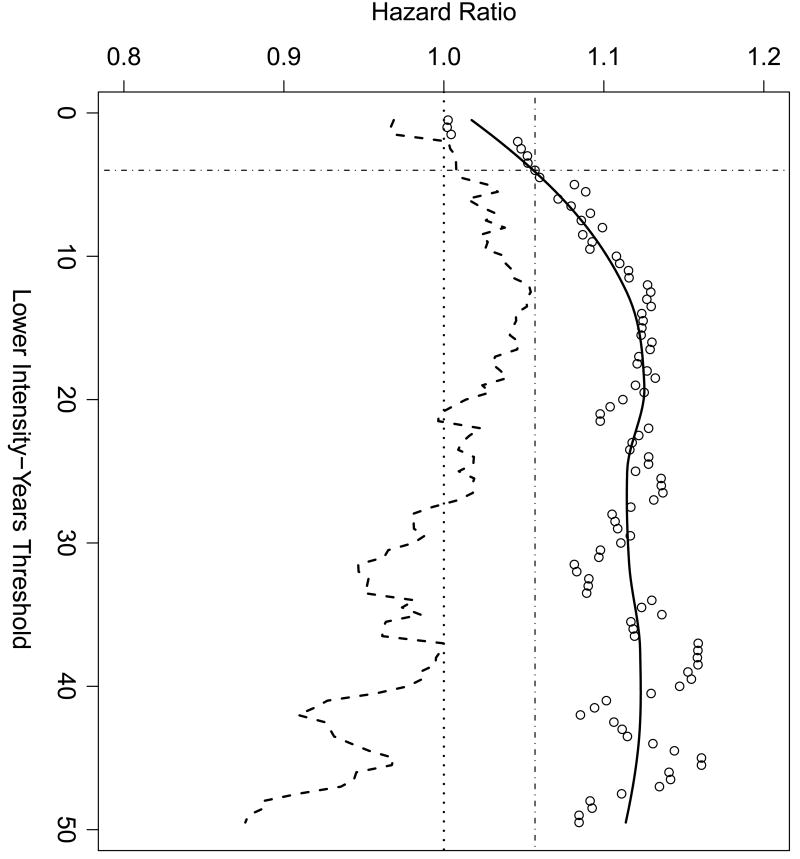
Figure 3.
The effect of changing the lower threshold for inclusion in the fit on the coefficient of the slope term in a proportional hazards model relating breast cancer to log2 intensity-years. Each dot represents an estimated hazard ratio for proportional hazards fit. The horizontal axis gives the lower inclusion threshold, the vertical axis gives the computed hazard ratio, and the dashed line shows the lower confidence interval for the fit. The solid line is a scatterplot smoother fit to the points. The thin vertical line marks the estimated slope when the threshold is 4, the value used in Figure 2. The thin horizontal line at 1.06 marks the hazard ratio corresponding a threshold of 4, as noted in the text.

